Commodity desk · ICE Sugar No. 11 (SB) · London White (SW)
Sugar · India
India is the world's largest cane grower and swings between sugar exporter and hoarder on the strength of one thing: the June–September southwest monsoon over Uttar Pradesh and the Deccan belt. Reservoir carryover then decides how much of Maharashtra's crop is planted at all.
ENSO state · through Sep 2026
very strong El Niño+3.40 · strengthening · Oct 2026 provisional +3.83
The Forecast Network's ERA5 multivariate ENSO index (the series behind celsius.earth/enso); positive is El Niño-like. Monthly means arrive about six weeks after the month; the provisional month is ERA5T and may still move.
Current stage
Grand growth★
Temp, next 2 wk
+0.2°C vs normal
Rain, next 2 wk
83 % of normal
SEAS5, next 3 mo
+1.8°C vs hindcast
Obs rain, 3 mo
114 % of normal
ENSO
very strong El Niño +3.4
The daily sheet · 2026-10-21 to 2026-11-03
Temperature anomaly · °C vs 1991–2025 normal
Rainfall · mm per day, brass dash = normal
Day-by-day ensemble means from the same ECMWF extended run as the weekly ledger — the short-term sheet a desk reads each morning. Days are UTC.
The six-week ledger · ECMWF extended ensemble, 2026-10-21 00z
Temperature anomaly · °C vs 1991–2025 normal
Rainfall · mm per week, brass dash = normal
The belts, first fortnight
Region
Temp anomaly
Rain
% of normal
Uttar Pradesh cane belt
-2.7°C
19 mm
121%
Maharashtra–Karnataka belt
+3.3°C
28 mm
67%
Ensemble-mean weekly aggregates over the desk's growing belts (land cells, production-weighted); whiskers show the ensemble spread carried with the mean — an upper bound for a weekly average. Weeks run from the initialisation date.
The plates · the fortnight on the map
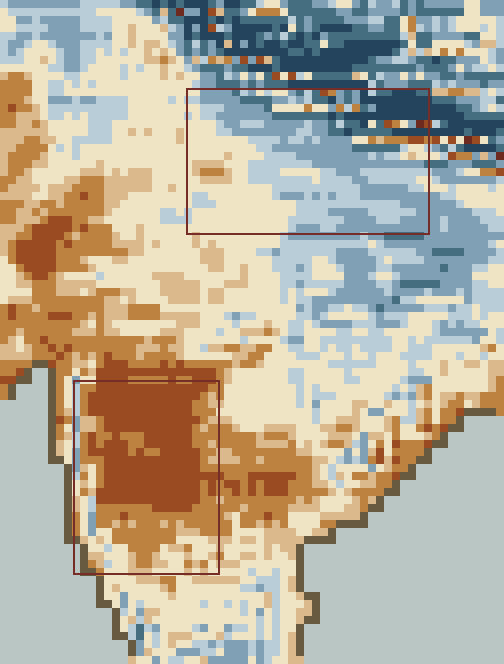
Temperature anomaly · Week 1 · 2026-10-21 → 2026-10-27
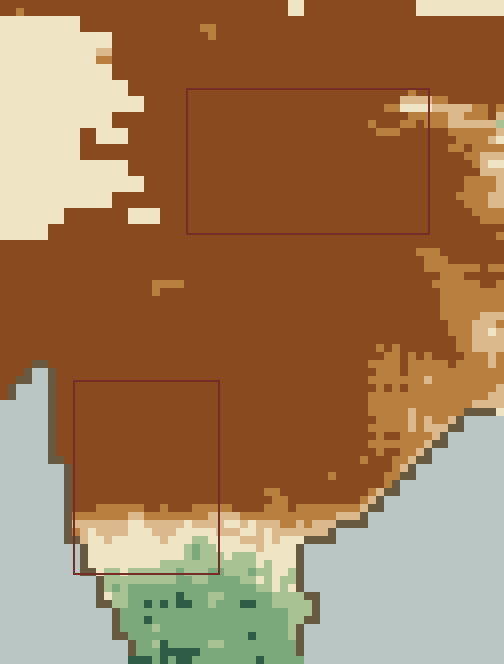
Rainfall, percent of normal · Week 1 · 2026-10-21 → 2026-10-27
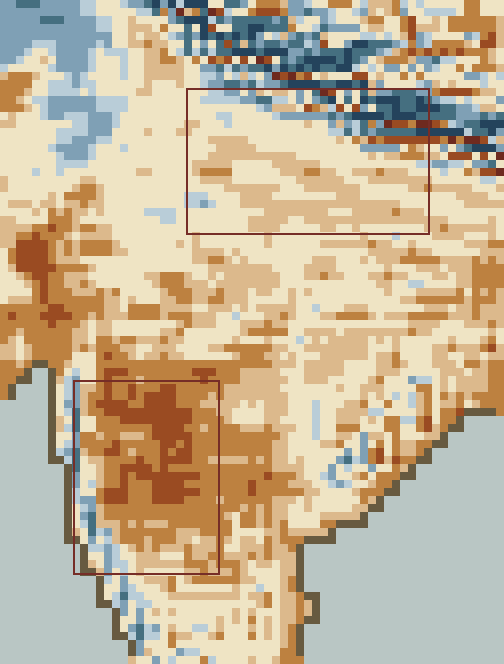
Temperature anomaly · Week 2 · 2026-10-28 → 2026-11-03
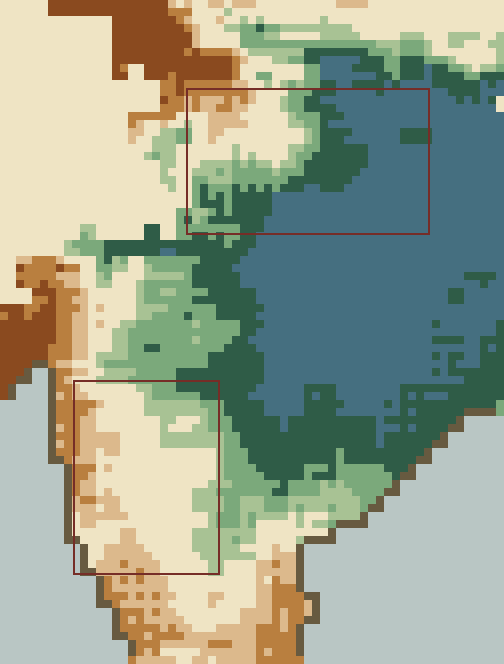
Rainfall, percent of normal · Week 2 · 2026-10-28 → 2026-11-03
Temperature anomaly (°C vs normal)≤ −4−4 to −2−2 to −1−1 to −½near normal+½ to +1+1 to +2+2 to +4> +4
Rainfall, percent of normal (% of normal rain)< 4040–6060–80near normal120–150150–200200–300> 300
EC-46 ensemble-mean weekly fields at 0.25°, painted in the Herbarium stepped ramps over the desk's belts (the oxblood rectangles). Near-normal stays paper; sea and no-data carry no ink; rainfall percent is unpainted where the weekly normal is under 2 mm. Cells are honest — drawn at the data's own resolution.
The seasonal ledger · SEAS5, initialised Oct 2026
Run-to-run · the last 6 initialisations
A forecast that holds its shape across initialisations deserves more weight than one that just appeared.
Latest run, month by month
Month
Temp anom
Rain anom
% of normal
Topsoil moisture anom m³/m³
Oct 2026 ◔
+1.8°C
-56 mm
24%
-0.068
Nov 2026
+1.8°C
+2 mm
112%
-0.018
Dec 2026
+1.8°C
+7 mm
185%
+0.006
Jan 2027
+1.8°C
+1 mm
110%
+0.006
Feb 2027
+1.9°C
-3 mm
73%
-0.004
Mar 2027
+1.3°C
+1 mm
107%
-0.000
Apr 2027
+1.2°C
-2 mm
87%
-0.004
◔ part elapsed. Anomalies vs the store's ERA5 hindcast climatology; percent-of-normal vs the AgroClim 1991–2025 normals. Topsoil moisture is volumetric water in the top 7 cm — negative is drier than the hindcast normal.
Rain that actually fell · CHIRPS, through Dec 2025
Monthly rainfall over the belts · mm, brass dash = 1991–2020 normal
Last 3 months 114% of normal
CHIRPS v3.0 satellite-gauge rainfall sampled at a lattice of land points across the desk's belts, production-weighted. Observed data, not a forecast.
The crop calendar · what this weather means now
Jan
Feb
Mar
Apr
May
Jun
Jul
Aug
Sep
Oct
Nov
Dec
Southwest monsoon ★
Grand growth ★
Crushing season
Planting (spring cane)
★ market-critical stage · the outlined column is the current month.
What the desk watches
Monsoon rainfall percent-of-normal — the single number the sugar trade prices off; deficits show up first in Maharashtra's rain-fed cane.
Post-monsoon soil moisture: cane is a 12–18 month crop, so a weak monsoon cuts both this season's yield and next season's planted area.
Heat during grand growth accelerates water demand where irrigation is thin.
Climate drivers
El Niño is the classic monsoon-deficit signal for India — not every event, but the exposure is asymmetric: a failed monsoon in the cane belt moves the world sugar balance more than a good one does.