Rice is the most political grain on Earth, and its price is set where the monsoon meets the paddies: India's Ganges basin — the world's largest exporter, whose bans move markets overnight — and the Mekong bowl that Thailand and Vietnam ship from. This desk watches the water.
ENSO state · through Sep 2026
very strong El Niño+3.40 · strengthening · Oct 2026 provisional +3.83
The Forecast Network's ERA5 multivariate ENSO index (the series behind celsius.earth/enso); positive is El Niño-like. Monthly means arrive about six weeks after the month; the provisional month is ERA5T and may still move.
Current stage
Kharif harvest · Mekong flood & salinity watch★
Temp, next 2 wk
+0.2°C vs normal
Rain, next 2 wk
100 % of normal
SEAS5, next 3 mo
+1.8°C vs hindcast
Obs rain, 3 mo
125 % of normal
ENSO
very strong El Niño +3.4
The daily sheet · 2026-10-21 to 2026-11-03
Temperature anomaly · °C vs 1991–2025 normal
Rainfall · mm per day, brass dash = normal
Day-by-day ensemble means from the same ECMWF extended run as the weekly ledger — the short-term sheet a desk reads each morning. Days are UTC.
The six-week ledger · ECMWF extended ensemble, 2026-10-21 00z
Temperature anomaly · °C vs 1991–2025 normal
Rainfall · mm per week, brass dash = normal
The belts, first fortnight
Region
Temp anomaly
Rain
% of normal
India Ganges basin
-1.1°C
33 mm
156%
Thailand & Mekong (Isan–Delta)
+1.7°C
73 mm
85%
Ensemble-mean weekly aggregates over the desk's growing belts (land cells, production-weighted); whiskers show the ensemble spread carried with the mean — an upper bound for a weekly average. Weeks run from the initialisation date.
The plates · the fortnight on the map
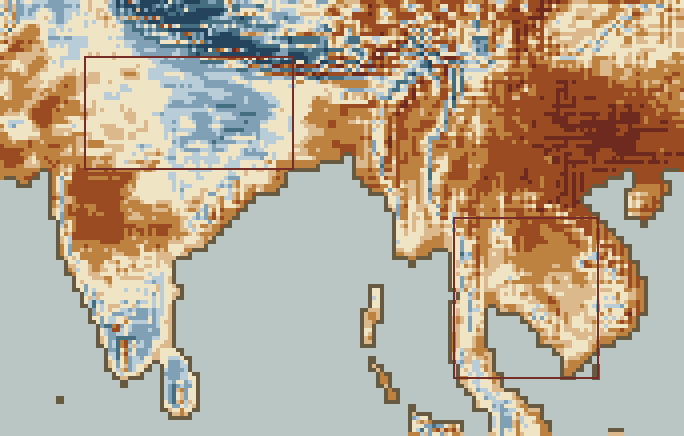
Temperature anomaly · Week 1 · 2026-10-21 → 2026-10-27
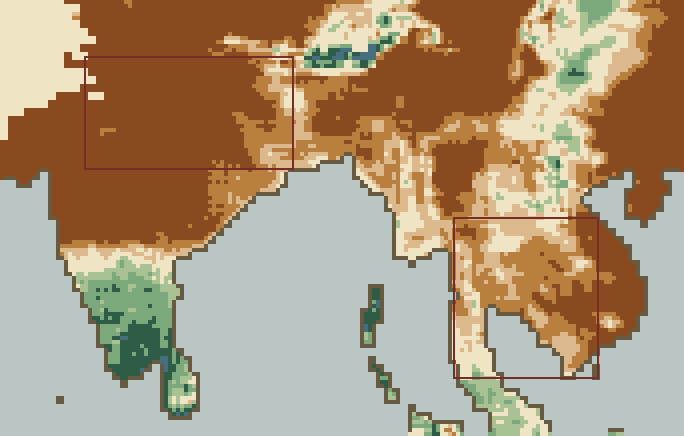
Rainfall, percent of normal · Week 1 · 2026-10-21 → 2026-10-27
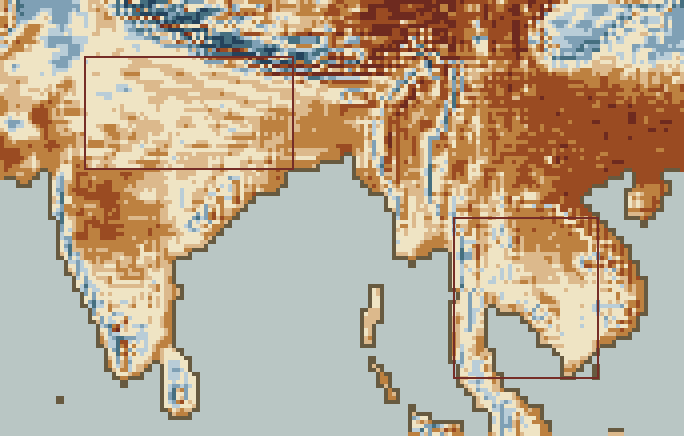
Temperature anomaly · Week 2 · 2026-10-28 → 2026-11-03
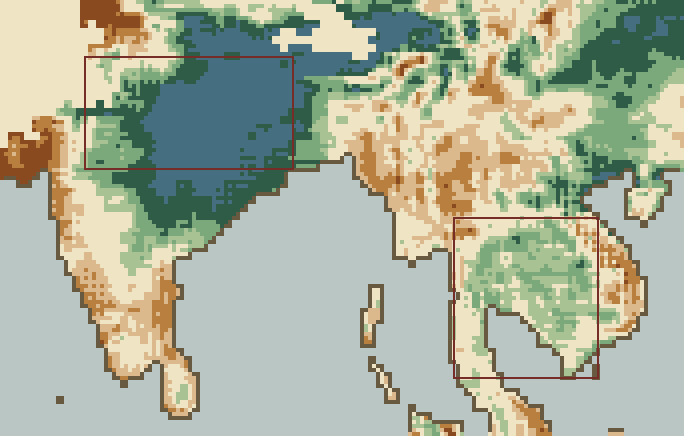
Rainfall, percent of normal · Week 2 · 2026-10-28 → 2026-11-03
Temperature anomaly (°C vs normal)≤ −4−4 to −2−2 to −1−1 to −½near normal+½ to +1+1 to +2+2 to +4> +4
Rainfall, percent of normal (% of normal rain)< 4040–6060–80near normal120–150150–200200–300> 300
EC-46 ensemble-mean weekly fields at 0.25°, painted in the Herbarium stepped ramps over the desk's belts (the oxblood rectangles). Near-normal stays paper; sea and no-data carry no ink; rainfall percent is unpainted where the weekly normal is under 2 mm. Cells are honest — drawn at the data's own resolution.
The seasonal ledger · SEAS5, initialised Oct 2026
Run-to-run · the last 6 initialisations
A forecast that holds its shape across initialisations deserves more weight than one that just appeared.
Latest run, month by month
Month
Temp anom
Rain anom
% of normal
Topsoil moisture anom m³/m³
Oct 2026 ◔
+0.9°C
-53 mm
60%
-0.033
Nov 2026
+1.7°C
+1 mm
103%
-0.013
Dec 2026
+1.8°C
+3 mm
114%
-0.001
Jan 2027
+1.9°C
-2 mm
88%
-0.001
Feb 2027
+2.0°C
-7 mm
63%
-0.007
Mar 2027
+1.7°C
-14 mm
58%
-0.011
Apr 2027
+1.9°C
-35 mm
35%
-0.025
◔ part elapsed. Anomalies vs the store's ERA5 hindcast climatology; percent-of-normal vs the AgroClim 1991–2025 normals. Topsoil moisture is volumetric water in the top 7 cm — negative is drier than the hindcast normal.
Rain that actually fell · CHIRPS, through Dec 2025
Monthly rainfall over the belts · mm, brass dash = 1991–2020 normal
Last 3 months 125% of normal
CHIRPS v3.0 satellite-gauge rainfall sampled at a lattice of land points across the desk's belts, production-weighted. Observed data, not a forecast.
The crop calendar · what this weather means now
Jan
Feb
Mar
Apr
May
Jun
Jul
Aug
Sep
Oct
Nov
Dec
Southwest monsoon — kharif ★
Kharif harvest
Dry-season / rabi crop
Mekong flood & salinity watch ★
★ market-critical stage · the outlined column is the current month.
What the desk watches
Monsoon rainfall percent-of-normal over the Ganges basin — the number behind every Indian export-policy headline.
Mekong wet-season flow: too little cuts the delta's dry-season crop via salt intrusion; too much drowns Cambodia and Isan at harvest.
Reservoir carryover into the irrigated rabi and winter-spring crops.
Climate drivers
El Niño weakens both the Indian monsoon and Mekong flows — the years India restricts exports are overwhelmingly El Niño years, and that policy response, not the crop loss itself, is what moves world prices.